Citational Network Graph of Literary Theory Journals
I’ve been interested in humanities citation analysis for some time now, though I had been somewhat frustrated in that work by JSTOR pulling its citation data from its DfR portal a year or so ago. It was only a day or two ago with Kieran Healy’s fascinating post on philosophy citation networks that I noticed that the Web of Science database has this information in a relatively accessible format. Healy used Neal Caren’s work on sociology journals as a model. Caren generously supplied his python code in that post, and it’s relatively straightforward to set up and use yourself.*
My first experiments with using Caren’s method were on the Journal of American Folklore, as a meta-analysis of that journal is the subject of an article that John Laudun and I have coming out in a few months, and John has been interested in folklore’s citation patterns for some time now. Here is the network graph** of the co-citations in that journal from 1973-present. (Web of Science’s data generally ends around this time; JSTOR’s did not, though my impression is that the WoS data is a bit cleaner.) Co-citational analysis and the community-detection algorithm produce much better results than my earlier efforts at citiational network analysis. (Healy’s post does a very good job of explaining what co-citation is and why it’s a useful way of constructing the network relations.) I then built two models of PMLA: sparse and larger. Even the sparse graph had only half the the threshold of Caren’s original code, which worked on several journals rather than just one. So I decided that I need more data to get better results.
Several months ago I built a topic model of six journals oriented towards literary theory. Somehow correlating a topic model with the journals' citation network is something I’ve been interested for some time. The first step here would be actually building the citation network of those journals. Unfortunately boundary 2 and Social Text are not in the Web of Science database. I added the journal of feminist theory Signs, (which I had also topic-modeled) to compensate, though the results are not going to be directly comparable to the theory-corpus topic model.
This corpus ended up being larger than Healy’s or Caren’s, so I had to adjust the threshold up to 11 to make it manageable. A drawback of D3.js is that it’s very processor-intensive. Here is an image of the network of the five journals:
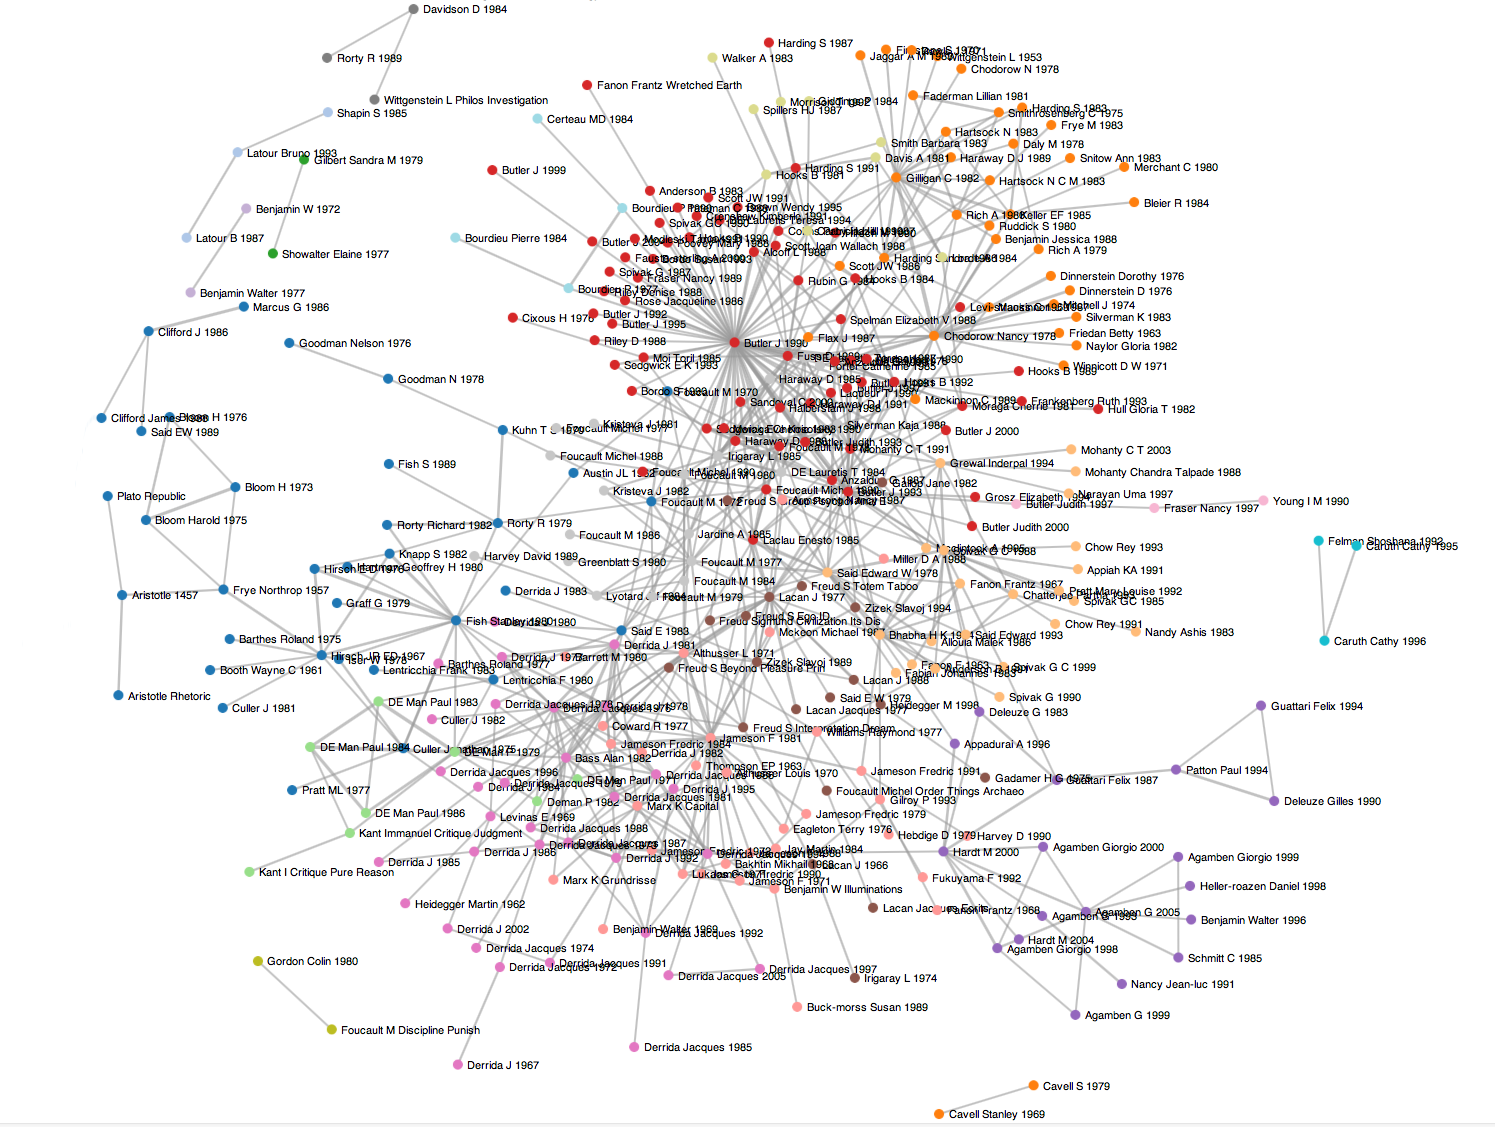
And here is the draggable network graph. The central nodes identified by the algorithm are Judith Butler’s Gender Trouble (1990) [red], Gayatri Spivak’s Can the Subaltern Speak (1988) & Edward Said’s Orientalism (1978) [light orange], Jacques Derrida’s Writing and Difference (1978) and Positions (1981) [light purple], Michel Foucault’s The Archaeology of Knowledge (1972) & Stanley Fish’s Is There A Text in This Class? [blue], Fredric Jameson’s The Political Unconscious (1981) (plus Althusser’s Lenin and Philosophy [1971]) [salmon pink], Carol Gilligan’s In A Different Voice (1982) & Nancy Chodorow’s The Reproduction of Mothering (1978), [orange], Pierre Bourdieu’s Distinction (1984), Michael Hardt and Antonio Negri’s Empire (2000) & Giorgio Agamben’s State of Exception (2005) [purple], and Jacques Lacan’s Ecrits (1977) [brown]. There is also a green Paul de Man node. Outliers include Hegel, Caruth, Clifford, Cavell, Wordsworth & Coleridge, and an interesting Latour-Bakhtin-Shapin nexus.
I would have liked to have explored this graph in D3 with a lower threshold, but my machine doesn’t have the processing power to handle that many nodes. I have been very happy using gephi in the past, but a java update seemed to make it stop working on my system. More interesting and perhaps unexpected results would appear at lower thresholds, I suspect, but I’m going to have to use another tool to visualize them. The results at this threshold meet my standard of face validity about the history of literary theory since the early 70s, though others might hold different opinions (it’s a contentious subject!).
UPDATE (6/23/13): I made a version of the dynamic graph that allows you to adjust the citation-threshold. There are also versions of a modernist-studies journals citation graph and one for journals in rhetoric and composition. And here is a post explaining the technical details.
*It relies on a couple of modules that are not installed by default on
most people’s machines, I believe. First you need to clone Drew Conway’s
fork (at the command line,
git clone git://github.com/drewconway/networkx, will do it). Then you
need to download this implementation of the Louvain network communtity
detection algorithm.
All of these files need to be in the same directory as Caren’s script. I
was unable to install the networkx fork on my Mac OS machine with pip,
easy_install, or anything else; but the local import worked fine. Once
you have set this up, you’ll need to modify by hand the filename in the
script with your results. You can also change the threshold by changing
the constants in this line:
if edge_dict[edge]>3 and cite_dict[edge[0]]>=8 and cite_dict[edge[1]]>=8 :.
Web of Science will only allow you to download 500 records at a time;
you can either write a script to concatenate your results or do it by
hand.
**All of these graphs use the D3.js library, which is very well designed and aesthetically pleasing. It renders very slowly on Firefox, however. Chrome and Safari give a much better viewing experience. (I have no idea about Internet Explorer.)